
Alright, let’s cut the noise — crypto pumps are no bedtime story, but a high-stakes game where discipline, calculated risks, and street-smart wisdom keep you ahead of the pack. A “pump” in crypto lingo is a sudden, sharp price increase, often driven by hype, news, or whale maneuvers — those big players with massive holdings who can move markets. Spotting them early isn’t luck; it’s skill honed from watching charts, reading signals, and yes, taking some hits along the way. If you’re tired of FOMO — fear of missing out — kicking in after the surge, this guide will arm you with the tools to get ahead. We’ll dive into verifiable signals, real examples from 2025’s wild rides, and strategies that have padded portfolios. Buckle up — knowledge like this can turn signals into serious gains.
First, understand the mechanics. Crypto pumps can multiply investments 10x or more in days, but they’re volatile beasts. From Bitcoin’s epic runs to meme coin madness like Dogecoin’s 2021 spike, history shows patterns. As of October 09, 2025, with Bitcoin at around $122,000 and the market cap nearing $4.25 trillion, pumps are more frequent amid institutional adoption. But spotting them requires blending technicals, fundamentals, and sentiment — no crystal ball needed, just diligence.
Volume Spikes: The First Red Flag of Incoming Pumps
Trading volume — the total amount of a crypto traded in a period, usually 24 hours — is the early warning system. When volume surges without obvious news, it’s often whales accumulating or retail piling in. A normal day for Bitcoin might see $50-100 billion in volume; a pump precursor could double that overnight. Picture it like a quiet party suddenly filling up — something big is brewing.
Take Bitcoin’s recent uptick in early October 2025. From September 17 at $116,456 to October 5 at $123,506, a 7.6% rise, volume spiked amid whispers of ETF inflows. This visual would pinpoint how volume led the price pump, giving savvy traders time to enter.
Tools like TradingView let you overlay volume on price charts. Set alerts for 50%+ spikes in 4-hour candles — that’s saved countless times. Remember, volume without price movement might signal accumulation; pair it with other indicators for confirmation.
Diving deeper, abnormal volume often precedes pumps in altcoins too. For instance, if an obscure token’s daily volume jumps from $1 million to $50 million, dig in — it could be a coordinated pump group or genuine interest. But beware fakes: Some exchanges inflate volume, so cross-check with multiple sources like CoinMarketCap or CoinGecko.
Volume analysis isn’t just about numbers; it’s about context. In bull markets, sustained high volume confirms strength, while in bears, it might signal capitulation. Pairing with price action — like breaking resistance levels — amplifies reliability. Historical data shows pumps with 200%+ volume increases often lead to 20-50% price gains within days. It’s like spotting storm clouds before the rain — get ready early.
Technical Indicators: Chart Patterns That Scream “Pump Incoming”
Technical analysis — studying price charts and patterns to predict moves — is the bread and butter. Key indicators like RSI (Relative Strength Index, measuring overbought/oversold conditions on a 0-100 scale), MACD (Moving Average Convergence Divergence, showing momentum shifts), and Bollinger Bands (volatility channels) flash pump signals.
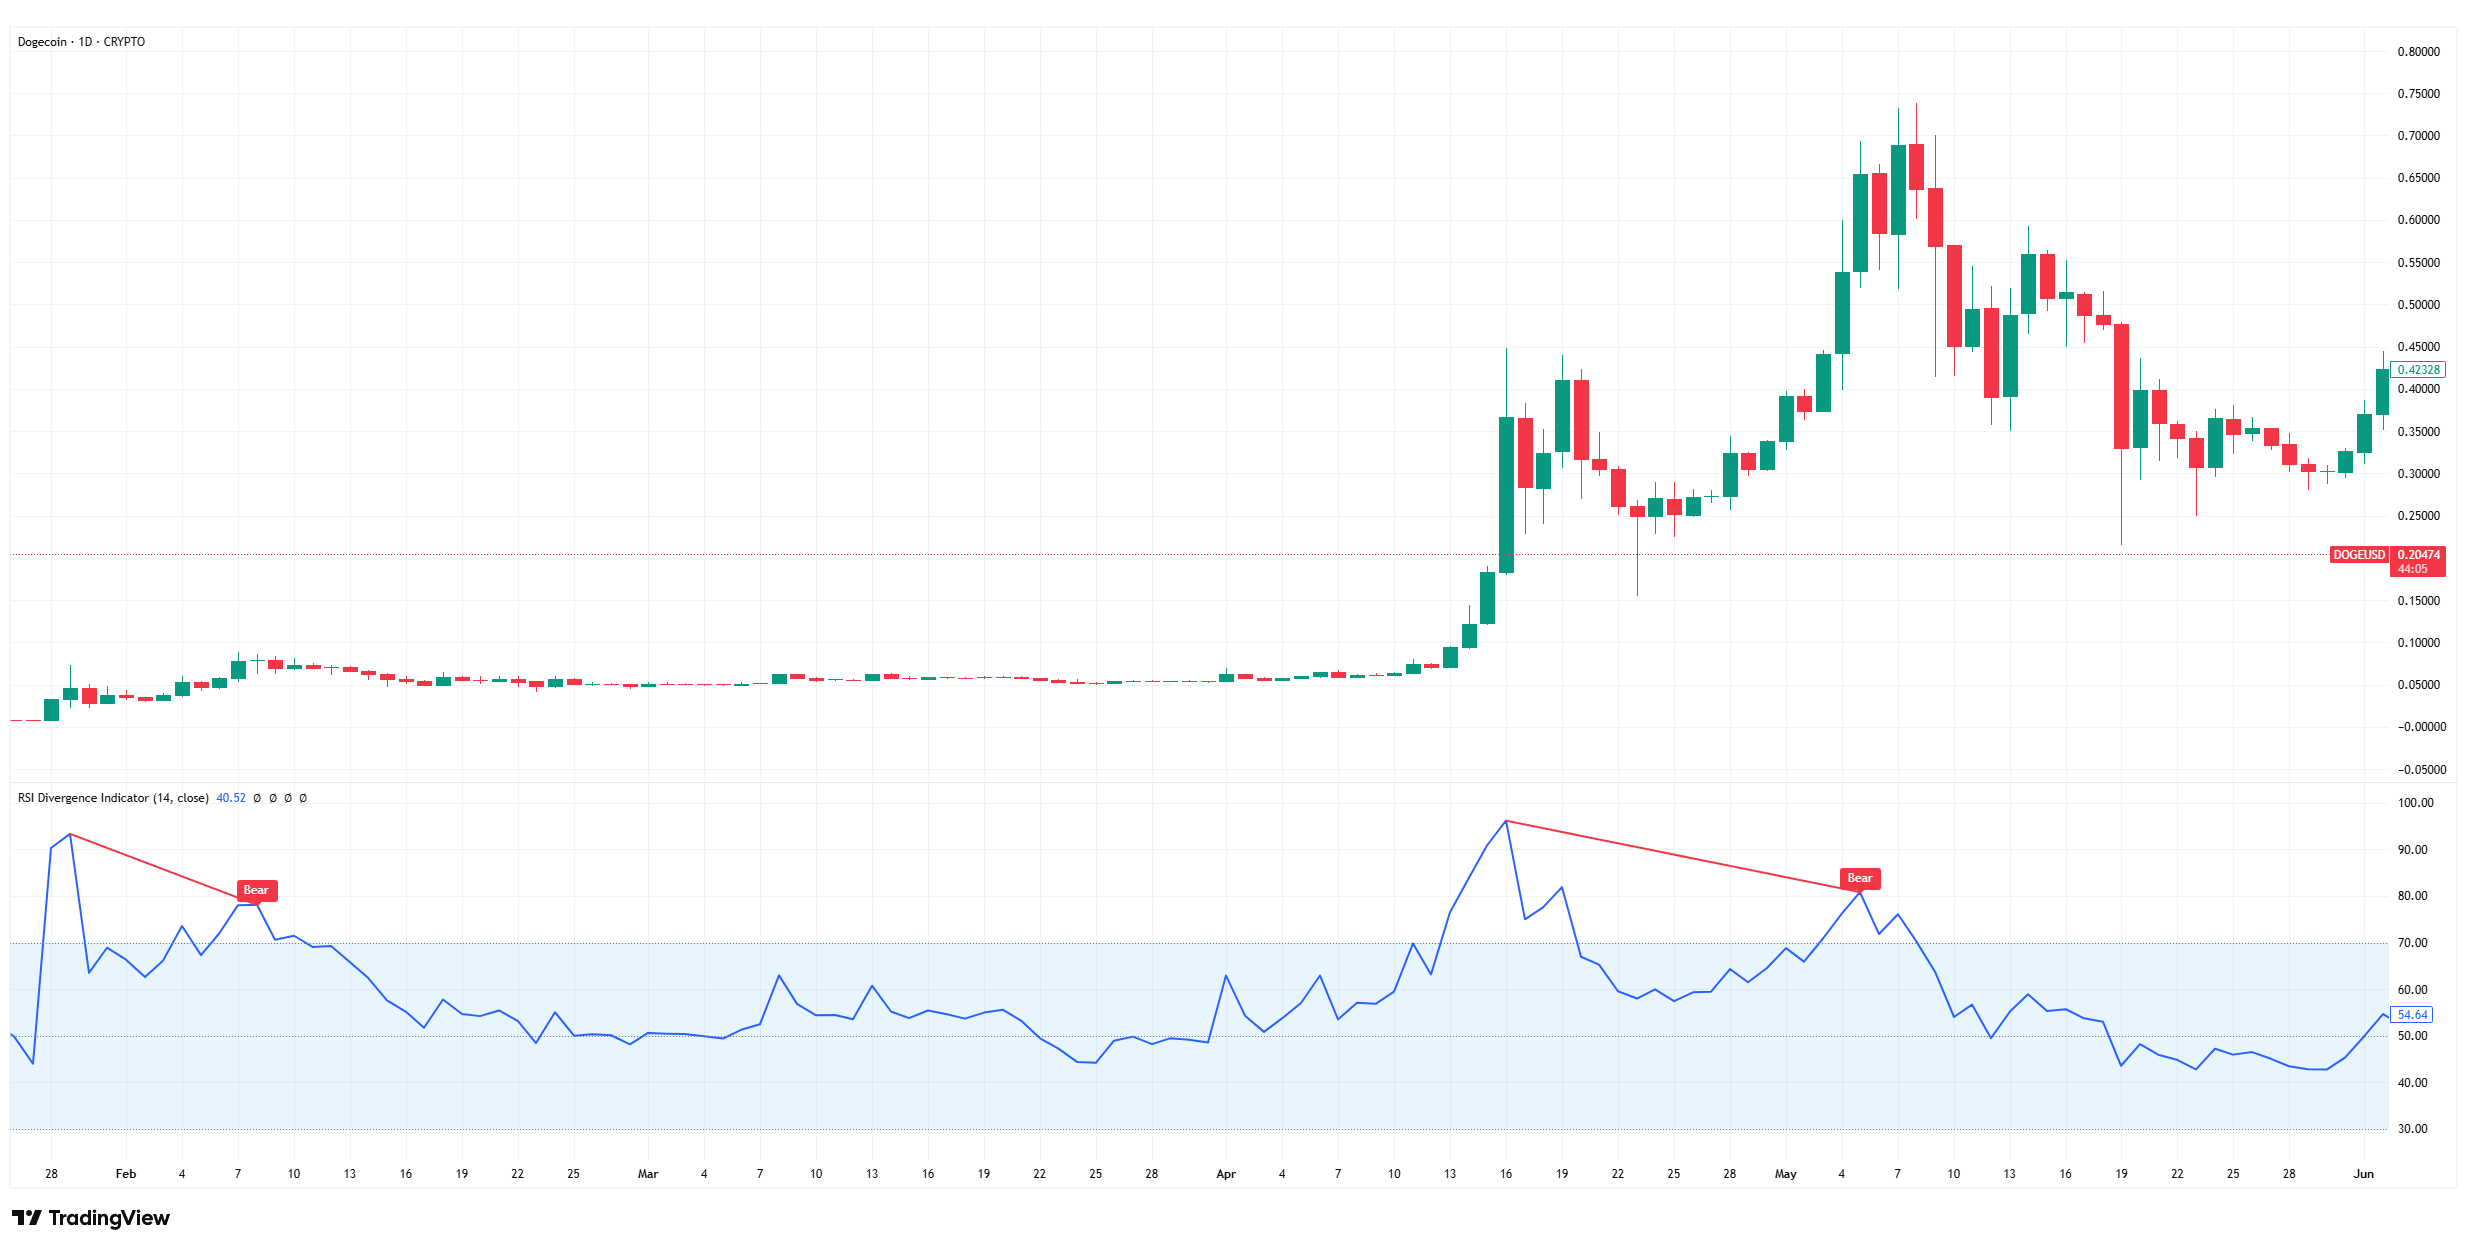
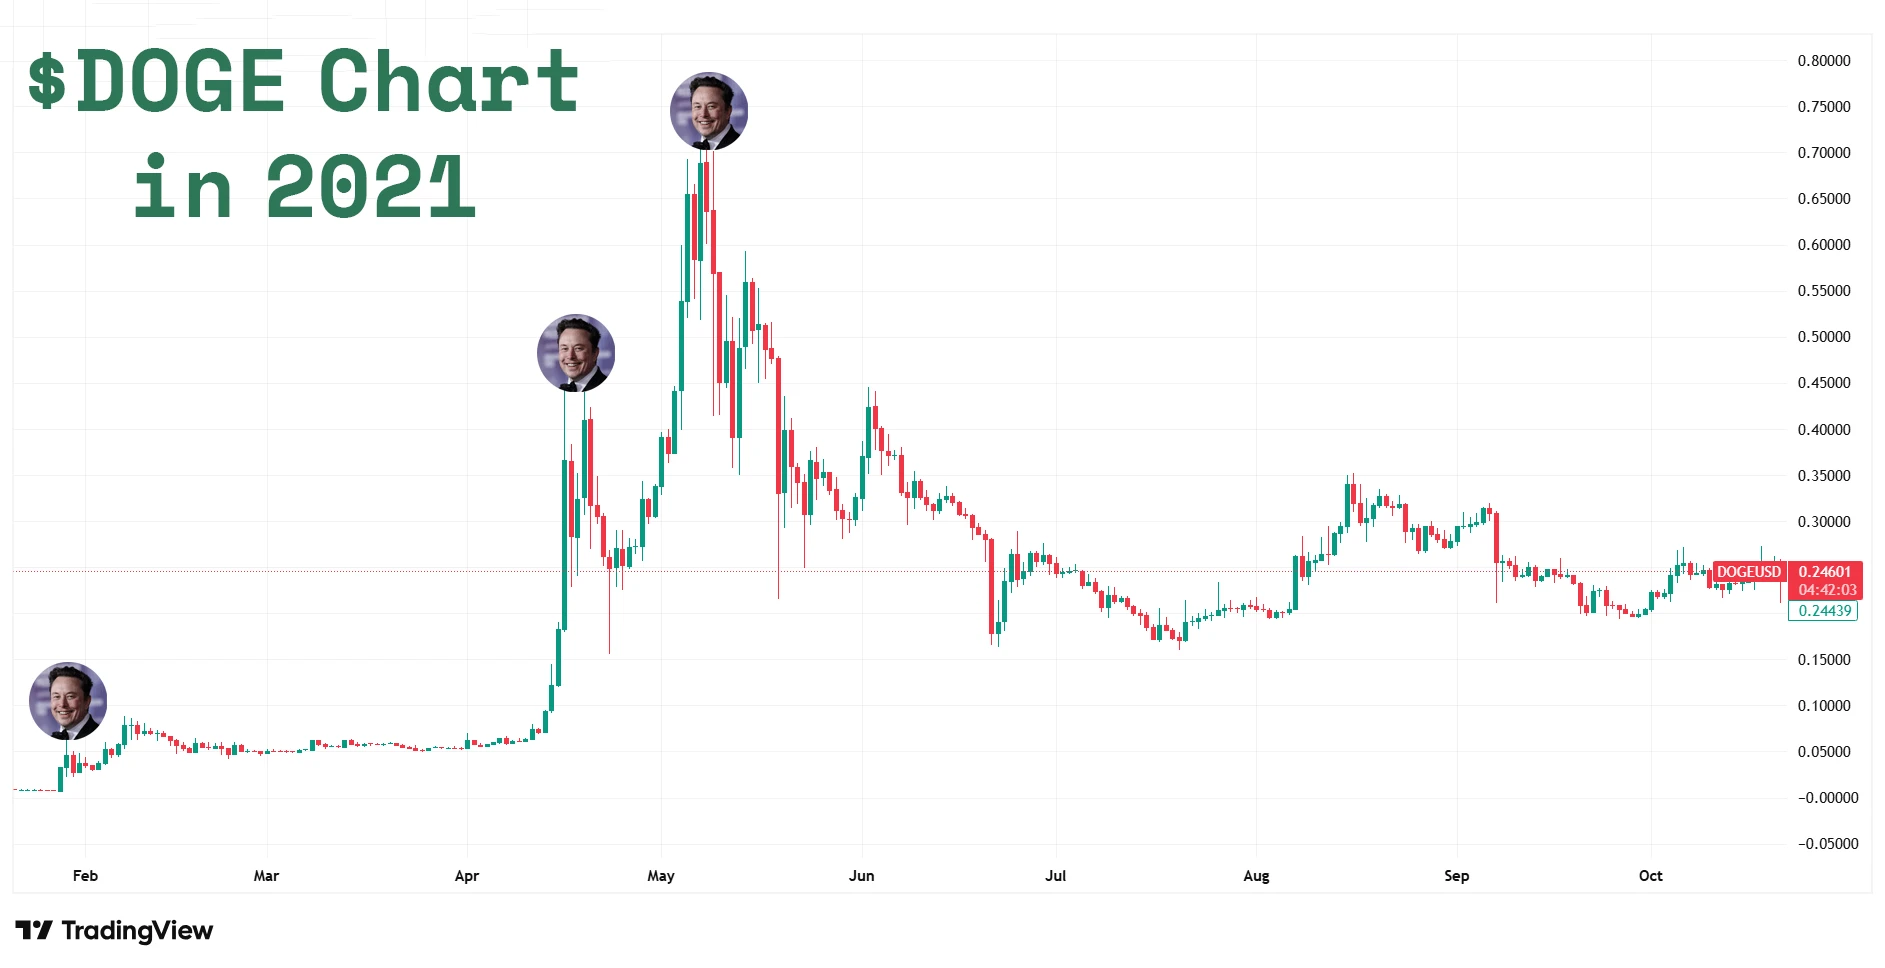
RSI below 30 often signals oversold, ripe for reversal pumps. In Dogecoin’s 2021 run, RSI dipped to 25 before exploding from $0.05 to $0.68 — a 1,260% gain. Fast-forward to 2025, Dogecoin’s September dip to $0.22 saw RSI at 28, hinting at the rebound to $0.245.
MACD crossovers — when the MACD line crosses above the signal line — indicate bullish momentum. Bitcoin’s 2017 pump from $998 to $19,343 (1,840% gain) featured multiple bullish MACD crosses.
Bollinger Bands squeeze — when bands narrow — precedes volatility explosions, often pumps. Ethereum’s 2021 surge from $1,300 to $4,300 coincided with a squeeze. As of now, with ETH at $4,300, watch for squeezes signaling the next leg up.
Combine these: A volume spike with RSI rebound and MACD cross is a triple threat. Used this combo to catch 5x gains on altcoins — discipline keeps you from false signals. It’s like having a secret decoder ring for the market’s whispers.
Advanced tip: Use Fibonacci retracements to spot pullback levels during pumps. After a surge, prices often retrace to 0.618 before continuing — golden ratio magic in charts. Add moving averages like the 50-day EMA for trend confirmation; crosses above signal bullish shifts.
Chart patterns like cup-and-handle or inverse head-and-shoulders also foreshadow pumps. In 2024, Bitcoin formed an inverse head-and-shoulders before breaking $100,000. Practice on historical charts to sharpen eyes — it’s like training for a marathon, but for your portfolio, and way more profitable.
On-Chain Metrics: Whale Watching and Transaction Clues
On-chain data — blockchain transactions visible to all — reveals insider moves. Whale alerts (large transfers) via tools like Whale Alert on X signal accumulation. A whale moving 1,000 BTC to an exchange might dump, but to a wallet? Pump brewing.
In 2025, Pump.fun on Solana dominated meme launches, capturing 75-80% with one-click minting — perfect for spotting new pumps. Track on-chain volume via Dune Analytics; spikes in unique addresses or gas fees hint at frenzy.
Example: Before Bitcoin’s 2021 pump to $64,000, on-chain transfers surged. Imagine overlaying on-chain transaction count from blockchain explorers to show correlation.
Token unlocks or burns reduce supply, pumping prices. Research via CoinMarketCap calendars — timed entries around them for 3x wins.
Glassnode provides premium metrics like SOPR (Spent Output Profit Ratio), where values above 1 signal profit-taking, potentially ending pumps. Free versions suffice for beginners. Other gems: Exchange inflows/outflows; net outflows often precede pumps as coins move to cold storage.
For altcoins, monitor smart contract interactions or wallet activity. Rising active addresses signal growing interest, a pre-pump tell. Tools like Nansen or Arkham Intelligence offer whale tracking, but start with free explorers like Etherscan for Ethereum-based tokens. It’s like being a detective in a digital gold rush — the clues are there if you know where to look.
Social Media and Sentiment: The Hype Machine
Sentiment — public opinion gauged via socials — fuels pumps. X buzz, Reddit threads, and Telegram groups amplify hype. Tools like LunarCrush track social volume; spikes predict pumps.
From X searches, pump groups hype tokens for coordinated buys — ethical? Debatable, but signals abound. Monitor hashtags like #CryptoPump or influencers with whale ties.
Meme coins thrive here: Dogecoin’s 2021 pump rode Elon Musk tweets. In 2025, similar vibes with tokens like MYX or Pump.fun launches.
Use Google Trends for search spikes — “Bitcoin ETF” searches preceded 2024 pumps. Combine with sentiment analyzers like Santiment for edge. Positive sentiment scores above 0.6 often correlate with 10-20% gains.
Discord and Telegram bots alert to mentions; set up for key coins. But filter noise — not all hype pumps; look for sustained buzz with on-chain backing. It’s the difference between riding a wave and getting wiped out by a ripple.
News and Catalysts: Event-Driven Pumps
News triggers pumps: Listings on Binance, partnerships, or halvings. Bitcoin’s 2024 halving pumped prices 50% post-event.
In 2025, Uptober hype — October’s historical bullishness — is pumping markets. Track via CoinDesk or X for real-time alerts.
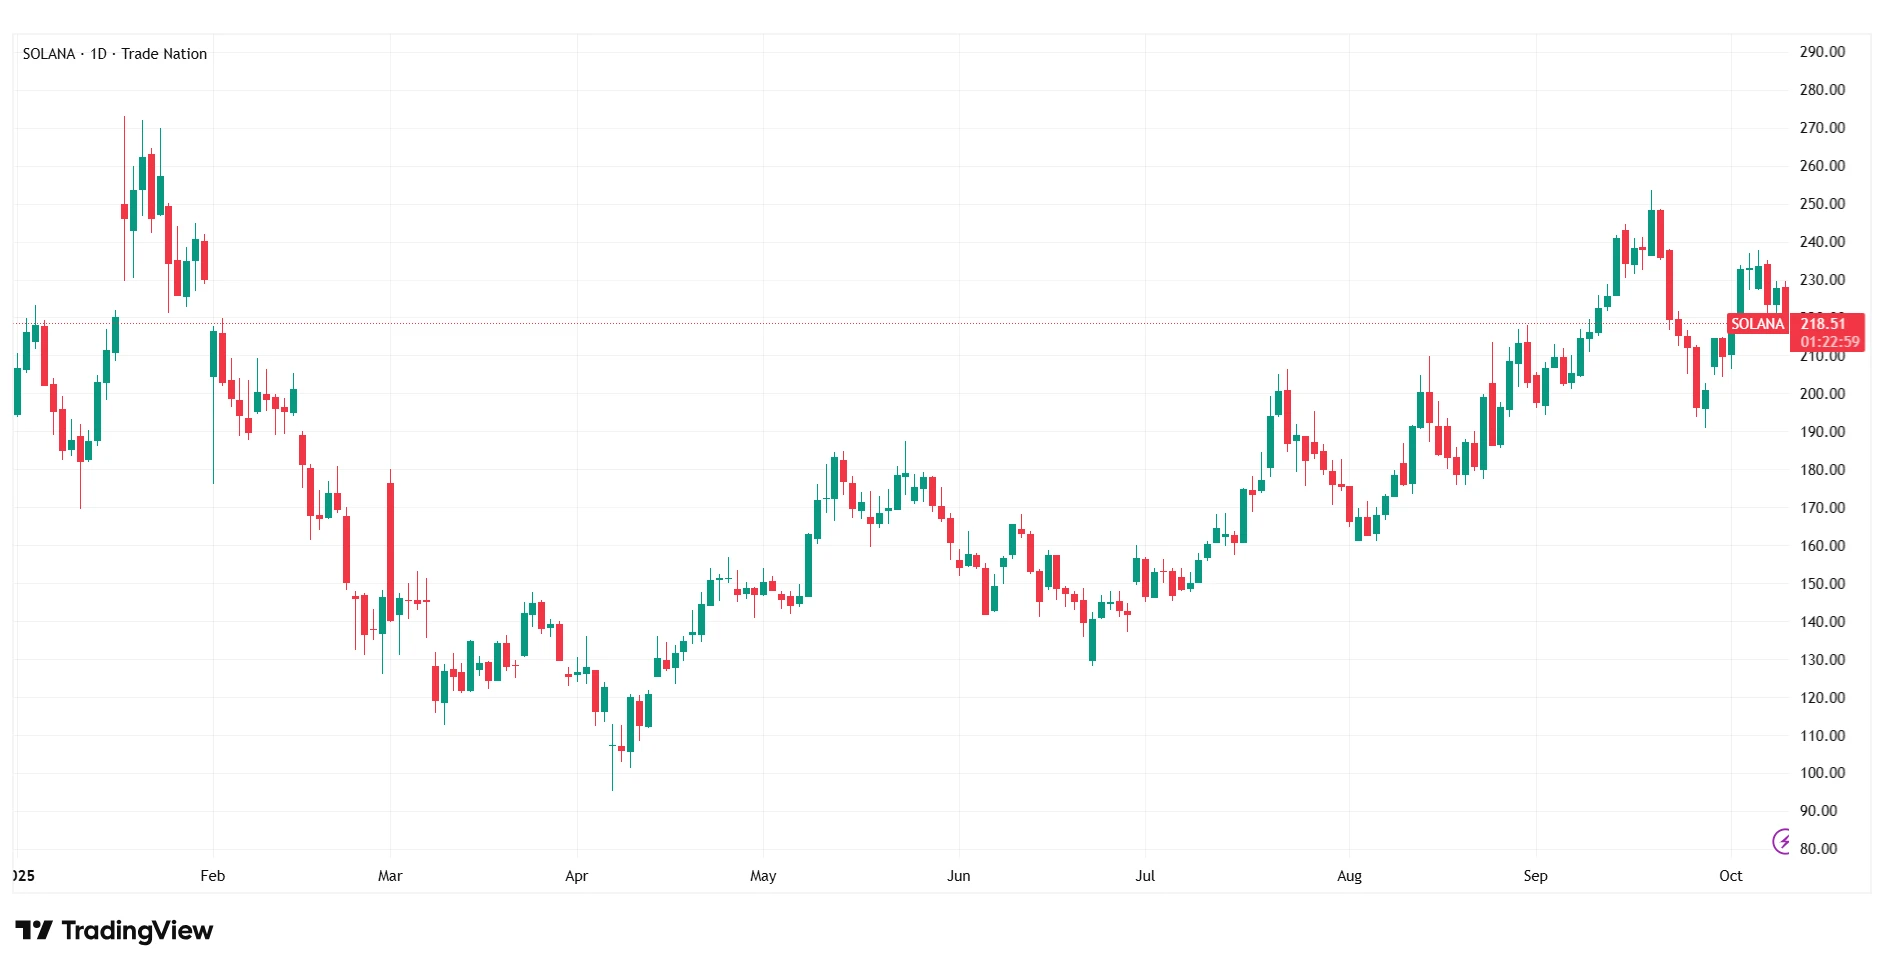
Example: Solana’s memecoin dominance via Pump.fun led to ecosystem pumps. Showing price surges tied to news events.
Regulatory news: SEC approvals pump, bans dump. Stay informed without overreacting — use calendars like Cointelegraph’s for upcoming events.
Partnerships, like a major firm adopting a token, can 2-5x prices. Follow press releases and verify sources to avoid fake news pumps. It’s like catching wind of a gold rush before the crowd arrives.
Case Studies: Real Pumps Dissected
Bitcoin 2017: From $998 to $19,343, driven by futures launch. Volume and sentiment spiked early.
Dogecoin 2021: $0.01 to $0.68, meme hype. Social volume exploded pre-pump.
2025 Recent: Bitcoin’s rise amid ETF buzz. Pump.fun tokens show micro-pumps.
Lessons: Early signals compound gains — HODL through volatility for max profits. For more on the power of holding, check out our article on Why HODLing Leads to Financial Freedom.
Another: Ethereum’s 2017 ICO boom, pumping from $8 to $300. On-chain metrics like contract deployments signaled influx.
Solana 2021: From $1.50 to $260, fueled by NFT hype. Social sentiment and volume led the charge.
Dissecting these builds intuition — practice on past charts to spot future winners. It’s the kind of edge that turns casual traders into consistent winners.
Risk Management: Don’t Get Dumped
- Pumps often end in dumps — sharp sells. Set stop-losses 10-20% below entry, take profits at 2-3x to lock in those wins before the tide turns.
- Avoid pump-and-dump schemes — illegal and risky. DYOR — do your own research — always, or you’ll end up holding the bag.
- Diversify: Don’t all-in on one signal. 5% portfolio max per trade keeps one bad call from ruining your day.
- Psychologically, greed kills. Set rules, stick to them for consistent wins — it’s the difference between thriving and surviving.
- Leverage sparingly — amplifies losses in dumps. Prefer spot trading for safety, unless you’re feeling bulletproof.
For a deeper dive into keeping your capital safe while chasing these opportunities, our guide on Mastering Risk Management in Crypto Trading is a must-read.
Tools and Resources for Pump Hunting
- CoinGecko: Charts, volume, news — your go-to for quick scans.
- TradingView: Custom indicators, alerts — build your war room here.
- DexScreener: Real-time DeFi pumps — spot the hidden gems before they blow up.
- X and Telegram: Sentiment tracking, whale alerts — the pulse of the community.
- Dune Analytics: On-chain dashboards — dive deep into the data ocean.
Build a dashboard — integrate alerts for volume, RSI, social spikes. Automation saves time, edges out competition, and lets you focus on the big picture.
Advanced Strategies: Layering Signals for Precision
- Combine on-chain with technicals: Whale buy + RSI bounce = entry — it’s like stacking the deck in your favor.
- AI tools analyze sentiment; quick scans for edge — tech making you smarter than the average bear.
- Backtest strategies on historical data — TradingView’s pine script for custom indicators turns guesswork into science.
- Machine learning models predict pumps based on past patterns — start with simple scripts to level up your game.
- Cross-chain analysis: Pumps on Ethereum often ripple to Solana; monitor bridges for flows — catch the wave across ecosystems.
Common Mistakes and How to Avoid Them
- Chasing pumps late: Enter on signals, not peaks — wait for confirmation, or you’ll buy the top every time.
- Ignoring fundamentals: Hype fades; ensure utility behind buzz, or it’s just a flash in the pan.
- Overleveraging: Wipes accounts — limit to 2-5x, or none, to live another day.
- Falling for scams: Verify teams, audits before diving — trust but verify, always.
- Avoid by journaling trades, reviewing losses for lessons — turn setbacks into setups for success.
Building Your Pump-Spotting Mindset
- Consistency beats genius. Study daily, adapt to markets — make it a habit, not a hobby.
- Develop discipline: Set routines for scanning signals — routine turns talent into triumph.
- Patience: Not every signal pumps; wait for confluence — good things come to those who wait smartly.
- Community: Join groups for shared insights, but verify independently — crowd wisdom with a solo check.
- Long-term: Use pumps to build positions for holds — short wins fuel long hauls.
In closing, spotting pumps is art and science — master it, and portfolios thank you. Signals turned into millions; you can too. Questions? Drop in comments — let’s hustle together. And if you’re hungry for more on navigating these volatile waters, grab my book Pump. Dump. Profit. — it’s packed with the raw truths that built my edge.
So true about whale wallets. saw a large btc moves last week on whale alert and the price pumped next day.
MACD + volume combo never fails. this post nailed it 💪
thanks for breaking it down so easy. i’m new and always thought “pump” meant scam lol
it’s crazy how predictable some pumps are once you notice patterns. feels like deja vu from 2021
good stuff bro. add some notes on exit strategies next time maybe? i always struggle knowing when to take profits
Respect! this is the kind of post that actually helps ppl make smarter moves, not just chase hype